Video: Precision Time Protocol (PTP) and Packet Timestamping in Linux

SMPTE’s ST-2110 standard can work on hardware or software, but its reliance on PTP, the Precision Time Protocol, makes full software support tricky. Why is this? Is this not just a question of more precise coding practices or changing programming language? There are times when PTP support for ST 2110 isn’t strictly needed and, indeed, the IPMX project is currently working on relaxing PTP requirements so that ST 2110 can be used in the ProAV market without ubiquitous PTP. But when you do need it on software deployed on a server, what are your options and what are the challenges?

This talk by Antoine Ténart looks at the pros and cons of using software vs hardware to create timestamps. First, however, Antoine looks at how PTP works. We’ve covered this before in a Cisco talk but Antoine points out that there are two methods that PTP can work, 1-step and 2-step. PTP synchronisation works by sending 2 messages from the grandmaster clock to the clock wanting to synchronise. There are also two messages sent back to the grandmaster. Keeping close track of when each of these messages was sent and received, and assuming the network delay is the same in both directions, you can work out how long it’s currently taking for timing messages to get to you. Once you’ve cracked the secret of how long messages get to you, you can accurately sync your clock to messages from the grandmaster which say ‘the time is currently …”


Without this exchange of messages, there’s no way to accurately synchronise your time with the PTP grandmaster within nanoseconds and you’d be left with NTP as your best option which can only keep accuracy within a few milliseconds. Some logs, transactions and media need much better accuracy than milliseconds. So with PTP relying on accurate timestamps, it’s important to find the best way to accurately stamp each message with its origin time.

Without hardware support, when the grandmaster sends its first message saying “This is the time”, a second message needs to be sent immediately afterwards saying “By the way, that last message actually left at a slightly different time:…” which is called the Follow-up Packet. Within broadcast, most equipment has hardware support and so can update the packet as it leaves the grandmaster with the actual time. When you can avoid the follow-up packet, this is known as a 1-step process.

As we covered in this the second talk from Cisco there is more than one type of clock: grandmaster, boundary and transparent. Antoine takes a moment to show how the boundary clock fits between end-devices and the grandmaster. For a deeper dive into PTP and its application to broadcast, watch Arista’s Gerard Philips in this IET Media talk.

Source: Antoine Ténart

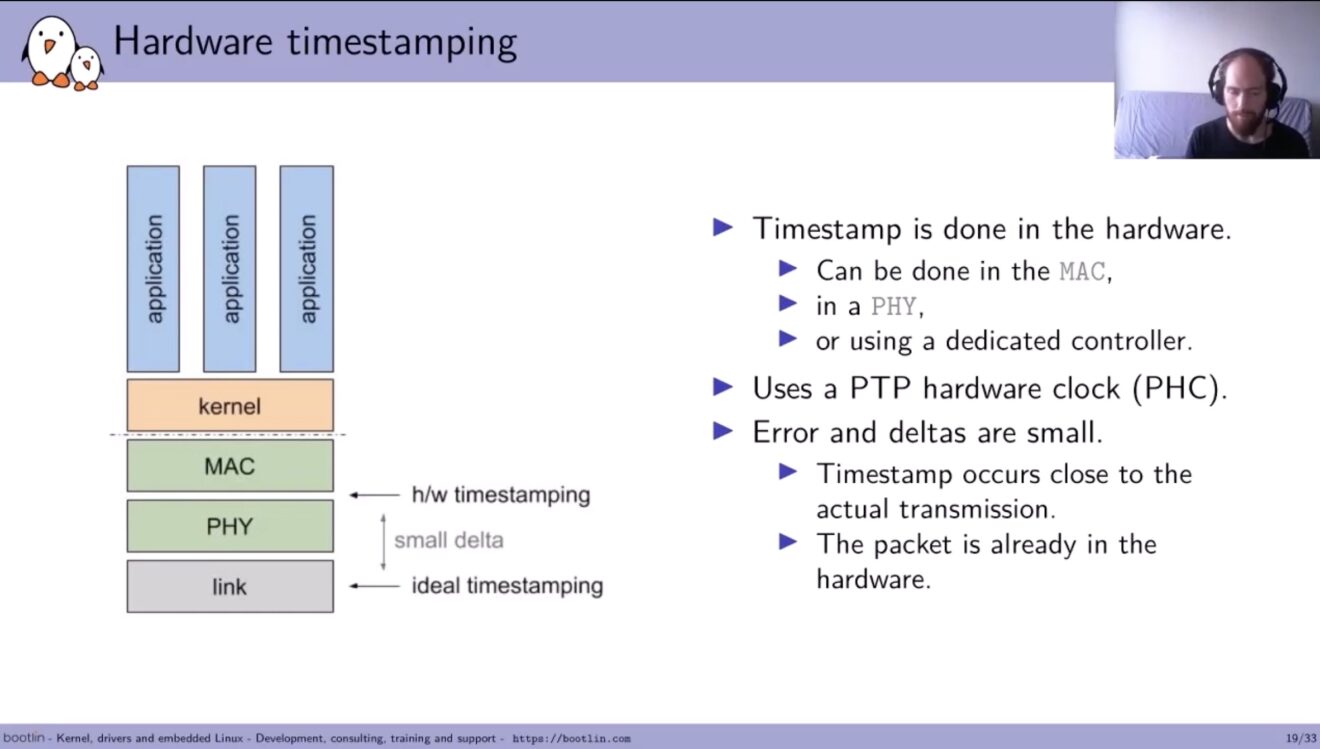
Antoine tackles both software and hardware timestamping next. Software, he shows is done in the application or the kernel using the system clock. The errors/deltas involved can be big with a long time passing before transmission. Not being certain when timestamps will occur leads to jitter in the timing signal.

Hardware insertion can be done in the Ethernet layer, in PHY or by a dedicated controller like the Mellanox X5 cards. Errors and deltas are small since the timestamp is inserted close to the actual transmission. In fact, the only delta is it crossing the PHY layer.

The video ends with Antoine discussing offloading, specific calls in the kernel such as SO_TIMESTAMPING and SO_TIMESTAMPTING_TX_HARDWARE as well as introducing us to some tools such as ptp4l, which is a PTP client and ptp2sys which updates the system clock to the ptp time.

Watch now!
Speaker

Antoine Ténart Antoine Ténart
Senior Software Engineer, Red Hat
Former Linux Kernel Engineer, Bootlin

Video: Debugging Streaming Errors with Video Analytics

Errors in streaming often require deep knowledge that system specialsts and developers have, but getting them the data they need is often an uphill struggle. This video shows ways in which we can short circuit this problem showing some approaches that Bitmovin is taking to get the data to the right people. Bitmovin announced, yesterday, €25M of further investment in the company. We’ve featured Bitmovin many times here on The Broadcast Knowledge talking about codecs, low-latency live streaming or super-resolution. Reading through this full list makes it clear that Bitmovin’s interested in the whole chain from encode to delivery.

Christoph Prager sets the scene looking at an analysis of errors showing that only 15% have a clear reason with 65% being ambiguous. If an error’s ambiguous, you need data to drill into it and disambiguate the situation. This is exacerbated by the standard aggregate metrics which make getting to the root cause very difficult. Definitions of ‘buffering percentage’ and ‘startup time’ are very useful to gauge the scale of an issue or to find there’s even a problem to begin with. But for developers, they are like the foreword to the book they need to read to find the problem. This has led Bitmovin to think from the angle that errors are a lot more obvious when you have the data.

Daniel Hölbling-Inzko takes us through Bitmovin’s new features to expose data surrounding errors. Whilst these will be coming to Bitmovin products, they show what a useful set of tools for debugging would be and can inspire the same in your platform if you are able to customise those aspects of it. Daniel points out that the right detailed information can be useful to customer support, but it’s the deeper information that he’s interested it. Bitmovin can collate all the stack traces from problem places but also track segments from the time there was an error.

Segment tracking shows the status, type, download speed, time to first byte and the size of each of 10 segments from around the time the error was collected. Viewing these can help see trends such as diminishing bandwidth or just simply show that a problem happened abruptly. Daniel talks through three errors where segment tracking can help you pinpoint problems: ‘NETWORK_SEGMENT_DOWNLOAD_TIMEOUT’, ‘ANALYTICS_BUFFERING_TIMEOUT’ and ‘DRM: license request failed’. Because the requests are now split out individually it makes it easy to see where the 403 error is that is stopping the DRM or how the internet speed is dropping resulting in an analytics timeout. Daniel highlights that it’s the trends that are usually the most important part.

Watch now!
Free Registration Required
Speakers

Christoph Prager Christoph Prager
Product Manager, Analytics
Bitmovin
Daniel Hölbling-Inzko Daniel Hölbling-Inzko
Engineering Director, Analytics
Bitmovin

Video: Precision Time Protocol (PTP) Clock Types

Part II in this Cisco series on PTP, Precision Time Protocol, focuses on Boundary Clocks and Transparent Clocks. Last week we heard how PTP maintains accurate time by calculating the delay between clocks and the grandmaster clock which is the source of time for the network. This video summarises how to distribute that source of time to all your devices and how to choose between the two methods.

Albert Mitchell from Cisco explains that transparent clocks are just that, they transparently let the timing data flow through. All they do is update the timestamps on the outgoing packets to compensate for the extra time getting through the switch. A boundary clock (BC), however, is a source of time of itself but gets its time from the grandmaster like any other clock. Acting in this dual way, it creates the boundary it’s named after. It’s a boundary because it provides time to other end devices on the network, These devices never see the grandmaster, they only see the BC. Likewise, the grandmaster only sees the BC acting like any ordinary clock sending delay requests. This means that the boundary clock can shield the grandmaster from the rest of the devices on the network. A grandmaster with 10 boundary clocks can deliver time to over a thousand endpoints without a problem. Without the boundary clocks, the grandmaster may not be able to handle the two-way conversations necessary with so many clocks.


For broadcast networks, boundary clocks are preferred as they enable easier diagnosis and can reduce the blast radius of problems. Importantly they can span multiple VLANs. Other benefits are that they filter packet delay variation and shields the downstream/following clocks from any transient changes in the grandmasters. The downside of BCs is that they do add small errors to the timing which can add up if multiple BCs are concatenated.

Transparent clocks, on the other hand, don’t help with scalability like BCs and are limited to single VLANs. On the plus side, they require no configuration and provide faster convergence.

Lastly, Albert looks at the Best Master Clock Algorithm (BMCA) which is the method used to determine which grandmaster is providing timing to the whole network. For a deeper dive into the BMCA, have a look at this Arista video on PTP timing. Albert gives a good starting overview of how the algorithm works, the data it needs to operate and advice on settings to make sure you know which clock will win in each instance.

Watch now!
Speakers

Albert Mitchell Albert Mitichell
Technical Marketing Engineer,
Cisco

Video: WebRTC: Mostly the video bits

Who better to dig below the surface of WebRTC, which delivers sub-second latency, than Sean DuBois, creator of the Pion WebRTC library? This video takes a different look at WebRTC to others that focus on latency or scaling. Rather Sean looks at congestion control and managing the impacts of congestion noting that people remember how bad the video got and not how nice your sign-up page was.

Congestion is inevitable in large ‘unmanaged’ networks such as the internet and on wifi and cellular networks. Sean points out that the use of MPEG codecs which add dependencies between frames magnify the effect of lost packets. With frame-by-frame codecs, dropping a frame and repeating the last one is barely noticeable, but with MPEG, many more could be damaged. WebRTC was implemented over UDP so it could use its own congestion control.

RTP and RTCP are the key to WebRTC’s congestion control. RTP is well known for carrying real-time media as it’s used for AES67 audio, SMPTE ST 2110 and ST 2022-6 to name just a few standards. RTCP is RTP’s sidekick. Whilst RTP does the legwork of carrying the media, the RTP Control Protocol (RTCP) passes messages to control the flow. In this case, Sean explains, the RTCP channel is used to tell the sender that it’s sending too much video or which packets it’s lost. In terms of mitigating congestion, the source can adjust the bitrate directly or change the resolution or the framerate of the video to bring the bitrate down indirectly.


Sean shows a summary diagram of congestion controller flow which is built to handle jitter and out of order packets. Buffers are the normal way of fixing out-of-order packets but they have a big downside of adding latency and exacerbating timing problems. WebRTC has to use the RTCP channel to make sure it can map packet timing with NTP, using Sender Reports, as each packet’s timing information is only relative. When packet loss is spotted NACK (negative acknowledgements) are sent via RTCP or if things are worse, a Picture Loss Indication is sent which request a new keyframe. Fixing any impairments that do occur can be done either with FEC or by concealing the error with some form of masking, nowadays this may be based on machine learning.

The talk finishes with a look at a number of innovative projects which use WebRTC in one way or another, including for file transfer.

Watch now!
Speakers

Sean DuBois Sean DuBois
Creator, Pion WebRTC
Developer, Apple