Errors in streaming often require deep knowledge that system specialsts and developers have, but getting them the data they need is often an uphill struggle. This video shows ways in which we can short circuit this problem showing some approaches that Bitmovin is taking to get the data to the right people. Bitmovin announced, yesterday, €25M of further investment in the company. We’ve featured Bitmovin many times here on The Broadcast Knowledge talking about codecs, low-latency live streaming or super-resolution. Reading through this full list makes it clear that Bitmovin’s interested in the whole chain from encode to delivery.
Christoph Prager sets the scene looking at an analysis of errors showing that only 15% have a clear reason with 65% being ambiguous. If an error’s ambiguous, you need data to drill into it and disambiguate the situation. This is exacerbated by the standard aggregate metrics which make getting to the root cause very difficult. Definitions of ‘buffering percentage’ and ‘startup time’ are very useful to gauge the scale of an issue or to find there’s even a problem to begin with. But for developers, they are like the foreword to the book they need to read to find the problem. This has led Bitmovin to think from the angle that errors are a lot more obvious when you have the data.
Daniel Hölbling-Inzko takes us through Bitmovin’s new features to expose data surrounding errors. Whilst these will be coming to Bitmovin products, they show what a useful set of tools for debugging would be and can inspire the same in your platform if you are able to customise those aspects of it. Daniel points out that the right detailed information can be useful to customer support, but it’s the deeper information that he’s interested it. Bitmovin can collate all the stack traces from problem places but also track segments from the time there was an error.
Segment tracking shows the status, type, download speed, time to first byte and the size of each of 10 segments from around the time the error was collected. Viewing these can help see trends such as diminishing bandwidth or just simply show that a problem happened abruptly. Daniel talks through three errors where segment tracking can help you pinpoint problems: ‘NETWORK_SEGMENT_DOWNLOAD_TIMEOUT’, ‘ANALYTICS_BUFFERING_TIMEOUT’ and ‘DRM: license request failed’. Because the requests are now split out individually it makes it easy to see where the 403 error is that is stopping the DRM or how the internet speed is dropping resulting in an analytics timeout. Daniel highlights that it’s the trends that are usually the most important part.
KPIs are under the microscope as Milan’s Video Tech meet up fights against the pandemic by having its second event online and focused on measuring, and therefore improving, streaming services.
Looking at ‘Data-Driven Business Decision Making‘, Federico Preli, kicks off the event looking at how to harness user data to improve the user experience. He explains this using Netflix’s House of Cards as an example. Netflix commissioned 2 seasons of House of Cards based not on a pilot, but on data they already have. They knew the British version had been a hit on the platform, they could see that the people who enjoyed that, also watched other films from Kevin Spacey or David Fincher (the director of House of Cards). As such, this large body of data showed that, though success was not guaranteed, there was good cause to expect people to be receptive to this new programme.
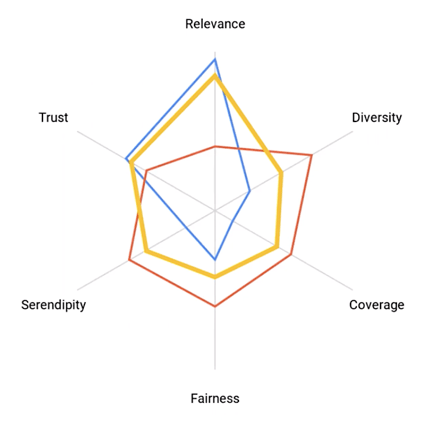
Federico goes on to explain how to balance recommendations based upon user data. A balance is necessary, he explains, to avoid a bubble around a viewer where the same things keep on getting recommended and not to exaggerate someone’s interests at the detriment of nuance and not representing the less prominent predilections. He outlines the 5 parts of a balanced recommendations experience: Serendipity, diversity, coverage, fairness & trust. Balancing these equally will provide a rounded experience. Finally, Federico discusses how some platforms may choose to under invest in some of these due to the nature of their platforms. Relevance, for instance, may be less important for an ultra-niche platform where everything has relevance.
‘Performance Video KPIs at the Edge‘ is the topic of Luca Moglia‘s talk. A media solutions engineer from Akamai, he looks at how to derive more KPI information from logs at the edge. Whilst much data comes from a client-side KPI, data directly reported by the video player itself to the service. Client-side information is vital as only the client knows on which button you clicked, for instance and how long you spent in certain parts of the GUI. But in terms of video playback, there is a lot to be understood by looking at the edge, the part of the CDN which is closest to the client.
One aspect that client-side reporting doesn’t cover is use of the platform by clients which aren’t fully supported meaning they report back less information. Alternatively, for some services, it may be possible to access them with clients which don’t report at all. Depending on how reporting is done, this could be blocked by ad blockers or DNS rules. As such, this is an important gap which can be largely filled by analysis of CDN logs. This allows you to enhance the data analysis done elsewhere and validate it.
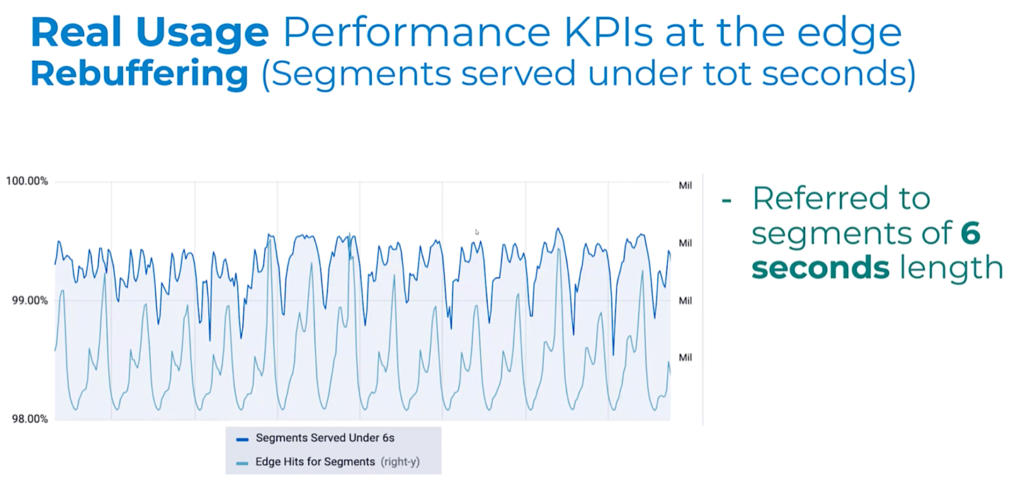
Luca gives examples of KPIs that can be measured or inferred from the edge, such as ‘hand-waving latency’ which can be understood from the edge-to-origin latency and time to manifest. He also shows an example graph analysing the number of segments served at the edge within the segment duration time. This helps indicate how many streams weren’t rebuffering. Overall, Luca concludes, analysing data from the edge helps track improvements, gives you better visibility on consumer/global events and allows you to enhance the performance of the platform.
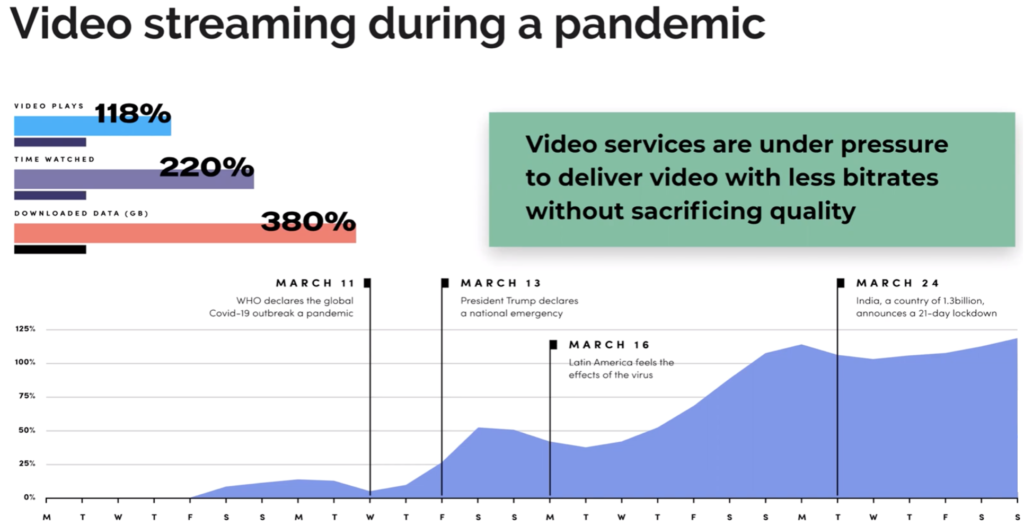
Bitmovin’s Andrea Fassina covers ‘Client KPIs – Five Analytics Metrics That Matter‘ which he summarises at the beginning of his talk ahead of explaining each individually. ‘Impressions & Total Hours Watched’ is first. This metric has really shown its importance as the SARS-CoV-2 pandemic has rolled around the globe. Understanding how much more people are watching is important in understanding how your platform is reacting. After all, if a platform is struggling this could be for many reasons that are correlated with, but not because of, more hours streamed. For instance, in boxing matches, it’s often the payment system which struggles before the streaming does.
Video startup time is next. Andrea explains the statistics of lost viewers as your time-to-play increases. You can look at startup time across each device and see where the low-hanging fruit for improvements and prioritise your work. This metric can be extended to ad playing and DRM load time which need to be brought into the overall equation.
Third is Video Bitrate Heatmap which allows you to see which type of chunks are most used and, similarly, which rungs on your ABR ladder aren’t needed (or could be improved.) The fourth KPI discussed is Error Types and Codes. Analysing codes generated can give you early warning to issues and allow you to understand whether you suffer more problems than the industry average (6.6%) but also proactively talk to connectivity providers to reduce problems. Lastly, Andrea explains how Rebuffering percentage helps understand where there are gaps in your service in terms of devices/apps which are particularly struggling.
Source: Andrea Fassina, Bitmovin
‘Video Quality Metrics‘ rounds off the session as Fabio Sonnati tackles the tricky problem of how to know what quality of video each viewer is seeing. Given that the publisher has each and every chunk and can view them, many would think this would mean you could see exactly what each stream would look like. But a streaming service can only see what each chunk looks like on their device in their environment. When you view a chunk encoded at 1080i on an underpowered SD device, what does the user actually see and would they have been better receiving a lower resolution, lower bitrate chunk instead?
In order to understand video quality, Fabio briefly explains some objective metrics such as VMAD, SSIM and PSNR. He then discusses the way that Sky Italia have chosen to create their own metric by combining metrics, subjective feedback and model training. The motivation to do this, to tailor your metric to the unique issues that your platform has to contend with. This metric, called SynthEYE, has been expanded to be able to run without a reference – i.e. it doesn’t require the source as well as the encoded version. Fabio shows results of how well SynthEYE Absolute predicts VMAF and MOS scores. He concludes by saying that using an absolute metric is useful because it gives you the ability to analyse chunk-by-chunk and then match that up with resolution and other analytics data to better understand the performance of the platform.
Discover the critical success factors the Broadcasters and platform owners, investing millions in building and upgrading OTT platforms, need to achieve to ensure they can compete successfully with a growing array of digital competitors and deliver compelling user experiences.
Many of these broadcasters are beginning to move from their initial OTT offerings to more mature services that can scale for the future, and answer the requirements of demanding viewers and regulators.
This webinar uncovers the essential parts of a flourishing OTT service, including:
– Delivering content at scale as more viewing and live events move to OTT
– Ensuring a class-leading user experience and quality
– Using analytics to maximise revenue and engagement
– Ensuring cost efficiency in the OTT workflow
– Securing platforms and content against piracy and malicious attacks
Date: Thursday July 12th, 11AM PT / 2PM ET / 19:00 BST
Data-driven insights can empower decision makers to enable a better online viewing experience for their audience, optimize their business, and create a competitive advantage in the industry. When it comes to online streaming, there are key metrics you should review to ensure audience engagement and provide high-quality experiences.
This webinar will provide insight into how you can leverage data, addressing the following topics:
How webcasting quality of experience (QoE) and quality of service (QoS) dashboards can provide the most critical information needed to troubleshoot live presentations in real time
How video publishers can use data and analytics in managing and improving their service
How QoE and QoS impact your audience and bottom line
How to drill down to the individual user level to gain 360-degree insight into viewer experience
What metrics and data points are the most important for video publishers and OTT services
How can QoE analytics be used to design streaming infrastructure and improve streaming performance.
REGISTER NOW to attend the webinar “Leveraging Data and Analytics to Improve Quality of Experience and Quality of Service.”
MODERATOR
SPEAKERS
Eric Schumacher-Rasmussen
VP / Editor
Streaming Media
Shaun Brown
Sr. Webcast Producer
MediaPlatform
Dina Durutlic
Product Marketing
Akamai
Kumar Subramanian
CEO
MediaMelon, Inc.
Brenton Ough
CEO
Touchstream
Subscribe to get daily updates
Views and opinions expressed on this website are those of the author(s) and do not necessarily reflect those of SMPTE or SMPTE Members.
This website is presented for informational purposes only. Any reference to specific companies, products or services does not represent promotion, recommendation, or endorsement by SMPTE