

KPIs are under the microscope as Milan’s Video Tech meet up fights against the pandemic by having its second event online and focused on measuring, and therefore improving, streaming services.
Looking at ‘Data-Driven Business Decision Making‘, Federico Preli, kicks off the event looking at how to harness user data to improve the user experience. He explains this using Netflix’s House of Cards as an example. Netflix commissioned 2 seasons of House of Cards based not on a pilot, but on data they already have. They knew the British version had been a hit on the platform, they could see that the people who enjoyed that, also watched other films from Kevin Spacey or David Fincher (the director of House of Cards). As such, this large body of data showed that, though success was not guaranteed, there was good cause to expect people to be receptive to this new programme.
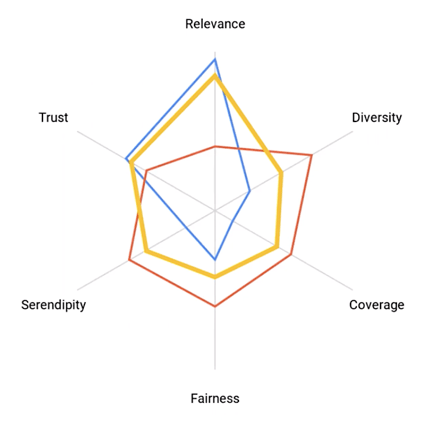
Federico goes on to explain how to balance recommendations based upon user data. A balance is necessary, he explains, to avoid a bubble around a viewer where the same things keep on getting recommended and not to exaggerate someone’s interests at the detriment of nuance and not representing the less prominent predilections. He outlines the 5 parts of a balanced recommendations experience: Serendipity, diversity, coverage, fairness & trust. Balancing these equally will provide a rounded experience. Finally, Federico discusses how some platforms may choose to under invest in some of these due to the nature of their platforms. Relevance, for instance, may be less important for an ultra-niche platform where everything has relevance.
‘Performance Video KPIs at the Edge‘ is the topic of Luca Moglia‘s talk. A media solutions engineer from Akamai, he looks at how to derive more KPI information from logs at the edge. Whilst much data comes from a client-side KPI, data directly reported by the video player itself to the service. Client-side information is vital as only the client knows on which button you clicked, for instance and how long you spent in certain parts of the GUI. But in terms of video playback, there is a lot to be understood by looking at the edge, the part of the CDN which is closest to the client.
One aspect that client-side reporting doesn’t cover is use of the platform by clients which aren’t fully supported meaning they report back less information. Alternatively, for some services, it may be possible to access them with clients which don’t report at all. Depending on how reporting is done, this could be blocked by ad blockers or DNS rules. As such, this is an important gap which can be largely filled by analysis of CDN logs. This allows you to enhance the data analysis done elsewhere and validate it.
Luca gives examples of KPIs that can be measured or inferred from the edge, such as ‘hand-waving latency’ which can be understood from the edge-to-origin latency and time to manifest. He also shows an example graph analysing the number of segments served at the edge within the segment duration time. This helps indicate how many streams weren’t rebuffering. Overall, Luca concludes, analysing data from the edge helps track improvements, gives you better visibility on consumer/global events and allows you to enhance the performance of the platform.
Segments served from the edge within the segment duration. 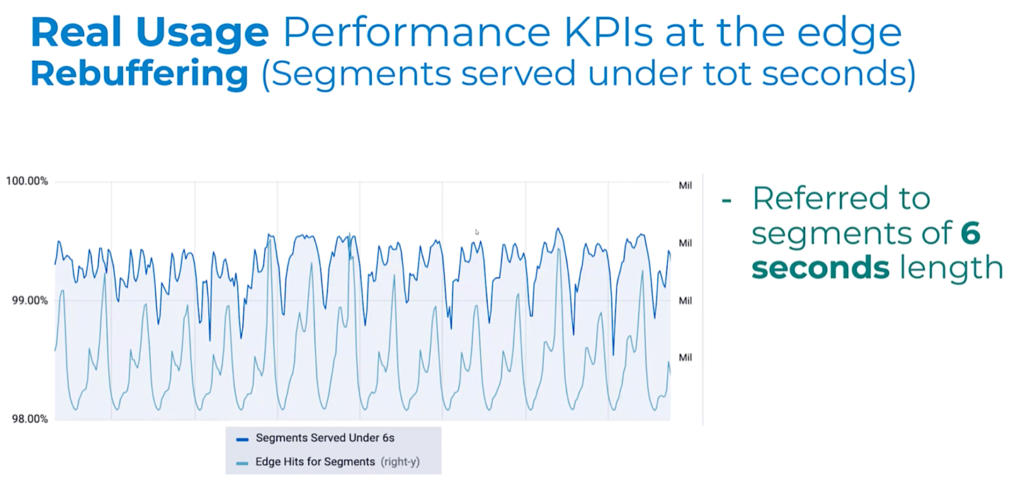
Source: Luca Moglia, Akamai Technologies
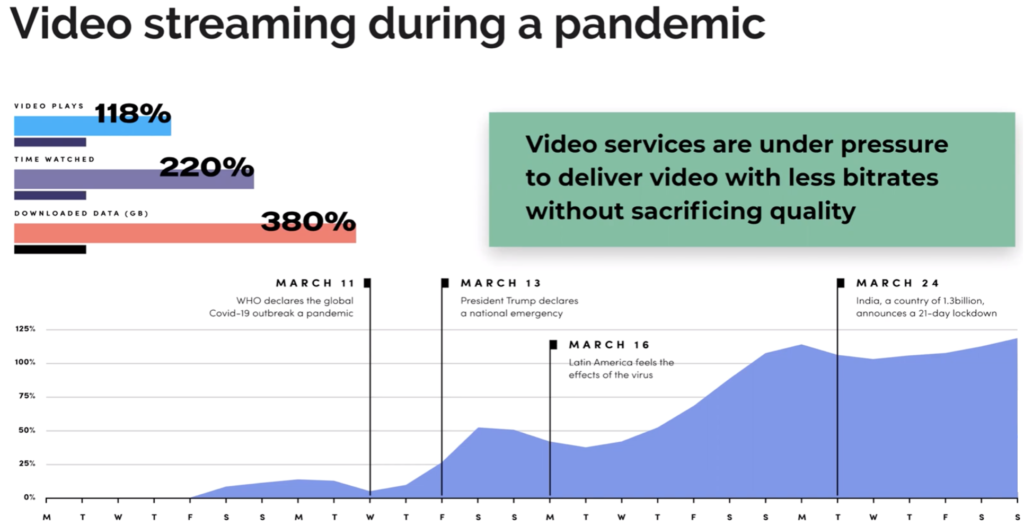
Bitmovin’s Andrea Fassina covers ‘Client KPIs – Five Analytics Metrics That Matter‘ which he summarises at the beginning of his talk ahead of explaining each individually. ‘Impressions & Total Hours Watched’ is first. This metric has really shown its importance as the SARS-CoV-2 pandemic has rolled around the globe. Understanding how much more people are watching is important in understanding how your platform is reacting. After all, if a platform is struggling this could be for many reasons that are correlated with, but not because of, more hours streamed. For instance, in boxing matches, it’s often the payment system which struggles before the streaming does.
Video startup time is next. Andrea explains the statistics of lost viewers as your time-to-play increases. You can look at startup time across each device and see where the low-hanging fruit for improvements and prioritise your work. This metric can be extended to ad playing and DRM load time which need to be brought into the overall equation.
Third is Video Bitrate Heatmap which allows you to see which type of chunks are most used and, similarly, which rungs on your ABR ladder aren’t needed (or could be improved.) The fourth KPI discussed is Error Types and Codes. Analysing codes generated can give you early warning to issues and allow you to understand whether you suffer more problems than the industry average (6.6%) but also proactively talk to connectivity providers to reduce problems. Lastly, Andrea explains how Rebuffering percentage helps understand where there are gaps in your service in terms of devices/apps which are particularly struggling.
Source: Andrea Fassina, Bitmovin
‘Video Quality Metrics‘ rounds off the session as Fabio Sonnati tackles the tricky problem of how to know what quality of video each viewer is seeing. Given that the publisher has each and every chunk and can view them, many would think this would mean you could see exactly what each stream would look like. But a streaming service can only see what each chunk looks like on their device in their environment. When you view a chunk encoded at 1080i on an underpowered SD device, what does the user actually see and would they have been better receiving a lower resolution, lower bitrate chunk instead?
In order to understand video quality, Fabio briefly explains some objective metrics such as VMAD, SSIM and PSNR. He then discusses the way that Sky Italia have chosen to create their own metric by combining metrics, subjective feedback and model training. The motivation to do this, to tailor your metric to the unique issues that your platform has to contend with. This metric, called SynthEYE, has been expanded to be able to run without a reference – i.e. it doesn’t require the source as well as the encoded version. Fabio shows results of how well SynthEYE Absolute predicts VMAF and MOS scores. He concludes by saying that using an absolute metric is useful because it gives you the ability to analyse chunk-by-chunk and then match that up with resolution and other analytics data to better understand the performance of the platform.
The session concluded with 20 minutes of Q&A
Watch now!
Speakers
 |
Luca Moglia Media Solutions Engineer, Akamai |
 |
Andrea Fassina Developer Evangelist, Bitmovin |
 |
Fabio Sonnati Media Architect and Encoding & Streaming Specialist |
 |
Federico Preli Senior Solution Architect, ContentWise |
 |
Moderator: Stefano Morello Senior Sales Engineer, ContentWise |